You cannot win every time
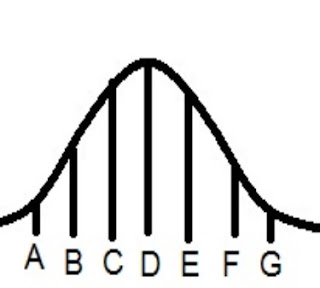
If you see the marks students get in a subject in your class, you will find that the largest number of people get average marks, while the number of those getting higher than the average gradually reduces. Similarly, the number of those getting less than average also reduces as you move away from the average. When teachers make a graph of the marks earned by the class, they get something that looks like this:
Image Credit: Monika Wahi, CC-BY-SA-4.0,
Image from Wikimedia Commons
In this example, we assume that D is the average score 50%. Other points are:
A 20%
B 30%
C 40%
E 60%
F 70%
G 80%
The
height above each letter shows how many people got that many marks:
2
students got 20%, 5 students got 30%, 7 students got 40%, 8 students got 50%
7
students got 60%, 5 students got 70%, and 2 students got 80%
Suppose
the test that the students took had 30 questions. It is unlikely that any
student will know the correct answer to all thirty questions. Some people know
the answer to question 1, some know the answer to question 2 and so on. Most of
the students know the answer to approximately 15 questions. The number of
students who know only 6 questions may be small. The number of students who
know the correct answer to 24 questions is also small.
The
remarkable thing is that similar graphs occur in many cases. If you make a
graph of the height of students in a class, you find a similar graph. If you
make a graph of the weight of fish caught by a fisherman, you get a similar
graph. Why?
The
height of students depends upon many things: height of father, height of
mother, the kind of food they eat, how many days they had a fever, and so on.
You cannot be lucky to have everything in your favour.
Similarly,
the weight of a fish depends upon so many different things, including its age.
Wherever
a number depends upon many things, we get this kind of graph. It is called the
normal distribution. For instance, toss a coin thirty times. How many heads do
you get? Write it down and do 30 more tosses? How many heads this time? Suppose
you repeat the 30 tosses 100 times. What will be the average number of heads in
thirty tosses?
You
will find that you get the same kind of normal distribution again. You cannot
get heads in every toss. Nor are you likely to lose every toss out of thirty,
by getting tails every time.
Srinivasan Ramani


Comments
Post a Comment